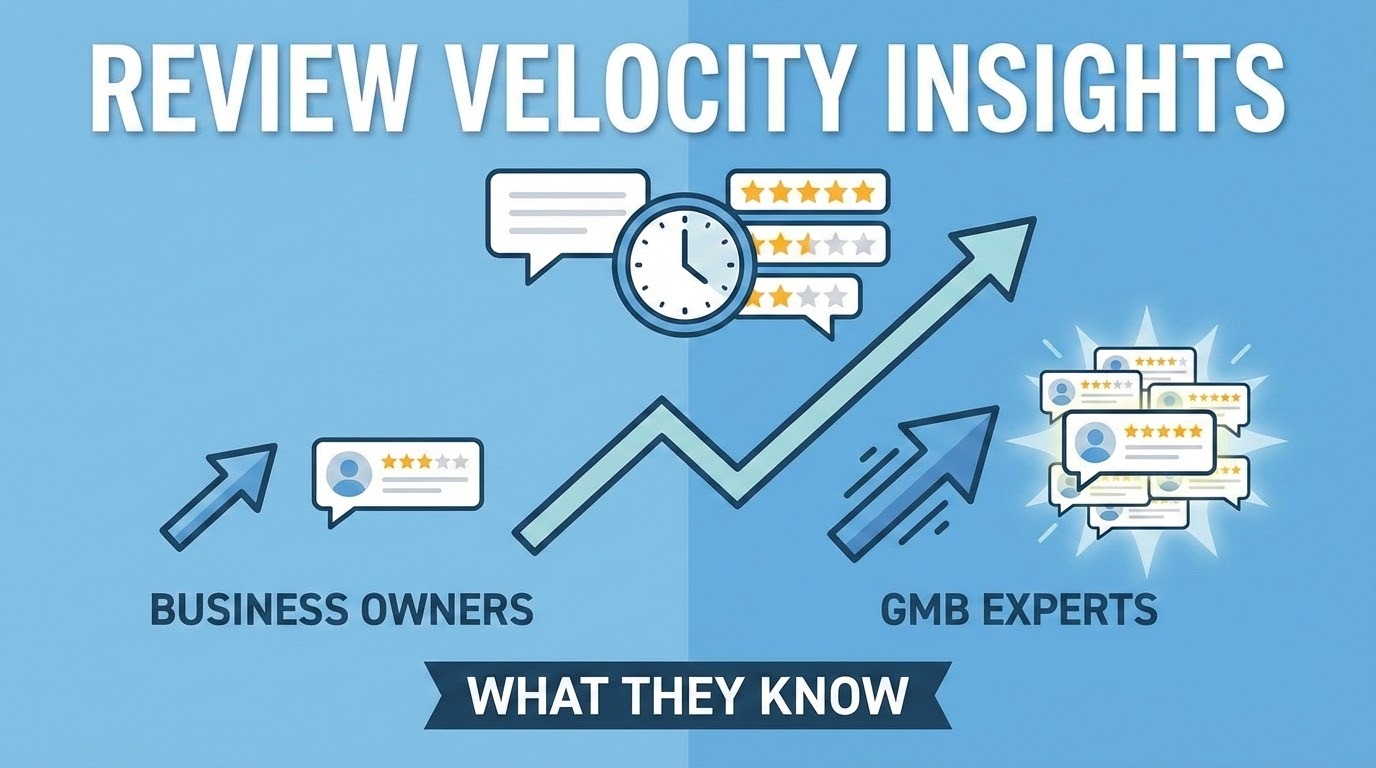
Most business owners track their total review count. GMB experts track something more useful: how fast those reviews are arriving. That distinction explains why a business with 85 reviews can outrank one with 200, and why a profile that looked strong six months ago can quietly slide down the map pack without losing a single star.
Review velocity is the metric that separates profiles that maintain local rankings from those that plateau and wonder why.
What Review Velocity Is and Why It Outweighs Total Volume
Review velocity is defined as the rate of new reviews over time, typically measured as reviews per week, combined with a recency factor that weights recent reviews more heavily than older ones. It captures both frequency and freshness, the two signals Google’s local algorithm prioritizes over accumulated totals.
The core metrics GMB experts track:
| Metric | Formula | Target |
| Weekly Rate | New reviews / 7 days | 10+ per week |
| Recency Index | % of reviews under 14 days old | 70% |
| Consistency Score | Standard deviation of daily reviews | Under 2 |
| Velocity Multiplier | Current week / prior week | Above 1.2 |
BrightLocal data shows businesses with 10 or more weekly reviews rank higher in the local pack than those with larger but stagnant profiles. A business with 30 reviews arriving at 10 per week beats one with 50 total reviews arriving at 1 per week. Velocity beats volume. That’s the core principle most owners miss.
Why Google’s Algorithm Weighs Recency So Heavily
Moz’s 2023 Local Ranking Factors study assigned review recency a 15.2% weight in local ranking signals, compared to 9.8% for total review volume. That gap reflects a deliberate algorithmic choice. Fresh reviews signal an active, currently trusted business. Old reviews, even a large stack of them, signal a business that customers once valued.
A Google patent (US20210287013A1) explicitly references temporal review signals as a factor in local relevance scoring. Review timing and frequency affect how Google interprets a business’s current standing, not just its historical performance.
The restaurant case that illustrates this clearly: a location with 200 reviews and zero new ones in the past month ranks 17th in the map pack. A competitor with 85 reviews and 12 new ones per month holds third place. Review momentum drives that gap.
The 7-Day Window That GMB Experts Build Around
Google applies a 3x recency multiplier to reviews posted within the past seven days. That weighting decays significantly after the window closes: reviews aged 8 to 30 days carry roughly 60% of their original influence, and reviews older than 31 days drop to around 25% of their original impact.
The practical implication is that five reviews in seven days outperform 20 reviews spread over 60 days in terms of algorithmic weight. Podium’s research confirms that businesses using focused 7-day velocity bursts consistently achieve stronger map pack positions than those with the same total volume accumulated over time.
Three tactics that build velocity within this window:
- Micro-bursts: Target three reviews per day via SMS or QR code immediately after service, sustaining 100% recency weighting without triggering Google’s pattern detection
- Review stacking: Schedule requests on Monday, Wednesday, and Friday to create clustered review momentum across the golden window
- Window resets: Keep gaps between reviews under 48 hours to maintain a continuous cycle refresh, using post-service funnels to prevent gaps
The velocity calculator GMB experts use: (Daily Reviews x 7) x Recency Multiplier. Three daily reviews over the 7-day window yield a score of 21 at full weight, far ahead of slower-accumulation strategies.
Four Automation Myths That Trigger Penalties
The shortcuts that seem to accelerate the collection of reviews almost always backfire. Google’s detection systems are more sophisticated than most business owners assume, and the consequences are permanent rather than temporary.
Myth 1: Review bots generate safe volume. Google detects unnatural review patterns and suspends accounts linked to fake review activity. A suspended GMB listing loses all review history and map pack visibility. Recovery is difficult and slow.
Myth 2: Offering discounts for five-star reviews is harmless. Incentivized reviews without disclosure violate Google’s guidelines. When flagged, those reviews are removed, and the profile faces ranking penalties that persist even after the reviews are removed.
Myth 3: Review gating improves ratings. Review gating, which means filtering out unhappy customers before they can leave feedback, can be detected through pattern analysis. Google penalizes profiles showing unnaturally skewed distributions. Natural review diversity outperforms manufactured averages in algorithmic weighting.
Myth 4: API posting bypasses standard review flows. Using APIs to submit reviews breaches Google’s terms of service. The consequence is immediate profile demotion or a permanent ban. Franchises that have tested this approach have lost visibility across multiple locations simultaneously.
BrightLocal data indicates most penalized profiles face recovery timelines measured in months, not weeks. The organic alternative is to train staff on post-service review requests and track response rates, which builds both compliance and consistent velocity.
How Request Timing Affects Response Rates
ReviewTrackers’ 2023 benchmarks show that review requests sent within two hours of service completion produce significantly higher response rates than those sent later the same day. The emotional context of a recent positive experience is the driver. Waiting past that window lets the moment fade.
| Service Type | Optimal Request Window | Response Rate |
| Plumbing | 1 to 2 hours post-job | 41% |
| Auto Repair | 45 minutes after pickup | 39% |
| Restaurants | 15 minutes after checkout | 38% |
| Retail | 30 minutes after purchase | 35% |
| Healthcare | 1 hour after the visit | 32% |
A three-step request sequence captures different customer response patterns: immediate SMS for fast responders, a 24-hour email follow-up for those who need a reminder, and a 72-hour message for stragglers. Conversion rates on review requests drop sharply after 48 hours, so the sequence front-loads the critical window.
Peak Hours for Review Request Conversion
Podium’s study of 50,000 business locations found that Tuesday through Thursday evenings between 6 and 8 PM produce the highest review response rates. Monday through Friday evenings average 52% engagement. Lunch hours hit 29%. Weekend requests lag at 18%.
Industry-specific peaks:
- Restaurants: Tuesday to Thursday, 6 to 8 PM
- Retail: Wednesday to Friday, 7 to 9 PM
- Service businesses: Monday to Thursday, 5 to 7 PM
- Healthcare: Tuesday to Wednesday, 6 to 8 PM
- Auto: Thursday to Friday, 6 to 7 PM
A/B testing across these windows consistently shows evening requests outperforming morning sends by a significant margin. Setting up Zapier triggers tied to job completion or checkout timestamps automates the timing without manual scheduling.
How GMB Experts Reverse-Engineer Competitor Review Strategies
The 28-day review pattern of a top-ranking competitor contains more useful information than most business owners realize. Monitoring competitor velocity with BrightLocal’s Review Tracker reveals whether they’re running burst strategies, steady-flow campaigns, or timing requests to coincide with peak traffic periods.
The four-step process:
- Monitor your top three local competitors daily through BrightLocal for four consecutive weeks
- Map their patterns: burst strategies show clustered reviews on specific days; steady-flow strategies show consistent daily volume
- Identify timing patterns, such as a restaurant competitor showing a Tuesday/Thursday spike after lunch rushes, which signals post-service request workflows tied to their busiest hours
- Set your own targets at 20% above the competitor benchmark to build a sustainable velocity lead
Industry benchmarks for weekly review rates, per BrightLocal data:
| Industry | Benchmark Reviews per Week |
| Dental | 12.4 |
| Restaurants | 9.2 |
| Retail | 7.1 |
The tool comparison for competitor tracking:
| Tool | Price | Competitor Tracking | Best For |
| BrightLocal | $29/mo | 50 competitors | Agencies |
| ReviewTrackers | $199/mo | 25 competitors | Enterprises |
| Podium | $299/mo | 10 competitors | SMBs |
| Birdeye | $299/mo | Unlimited | Franchises |
Scaling Review Velocity Across Multiple Locations
Franchises scaling from 1 to 50 locations increase review velocity by up to 8x with centralized management platforms like Birdeye. Managing 2,400 weekly review requests across locations manually isn’t workable. A central dashboard unifies requests, tracks performance by location, and identifies lagging sites.
Target rates by location count, based on industry benchmarks:
- 1 to 5 locations: 10 reviews per week per site
- 6 to 20 locations: 9 reviews per week per site with automated follow-ups
- 21 to 50 locations: 8.5 reviews per week using leaderboard incentives for managers
- 50 or more locations: 8 reviews per week per location via cross-location benchmarking
A dental franchise case documents what this looks like in practice. Starting at 3.2 reviews per location per week, they scaled to 11.8 per week after implementing a centralized system with location-specific QR codes and a manager leaderboard tied to bonuses for top performers. The result was a 14-position improvement in map pack rankings across locations.
Recovering from a Review Drought
A review drought is defined as a period of 21 or more days during which a business receives fewer than two new reviews per week. Drought conditions weaken recency signals, reduce algorithmic weighting, and allow competing profiles to gain ground on previously stable rankings.
Early warning signs:
- Weekly review rate drops below two for three consecutive weeks
- Competitors’ review velocity accelerates while yours stalls
- GBP Insights shows declining impression counts without a corresponding drop in customer traffic
- Star rating remains static, but map pack position slides
A 7-day recovery protocol from ServiceM8 case studies:
- Days 1 to 2: Contact your top 20% of customers (by spend or visit frequency) with personalized email or phone requests. These relationships yield the fastest, most authentic responses.
- Days 3 to 5: Launch a staff incentive program at $5 per verified review collected through compliant post-service requests. Train the team on timing and phrasing.
- Days 6 to 7: Host an event or open house and capture reviews on-site using QR codes while the customer experience is fresh.
When executed consistently, this protocol generates sufficient review bursts to restore map pack positioning within two weeks, per ServiceM8’s documented outcomes.
Long-Term Drought Prevention
NetReputation, which monitors search presence across business categories, has documented how review droughts affect not just rankings but also AI-generated summaries, which now pull review signals directly into local search results. Maintaining review velocity isn’t just a map pack issue anymore. It feeds the same data layer that generative AI uses to describe your business to searchers.
Ongoing prevention strategies:
- Maintain post-service email and SMS requests as a standard workflow, not a campaign
- Use loyalty program touchpoints for review solicitation, without tying reviews to specific ratings or rewards
- Run monthly review campaigns with varied formats, such as photo reviews or service-specific prompts, to prevent channel fatigue
- Conduct weekly velocity checks against competitor benchmarks using Birdeye or BrightLocal
Diagnosing and Breaking Through Velocity Plateaus
Plateaus happen when review generation stalls despite an active business. The five most common types, and the fixes that work:
| Plateau Type | Cause | Fix |
| Request fatigue | Customers ignore repeated asks | Rotate three request formats: email, SMS, and in-person |
| Low conversions | Requests sent, but few reviews posted | A/B test message length and call-to-action phrasing |
| Staff resistance | Team avoids asking for reviews | Introduce gamification with leaderboards and small rewards |
| Channel saturation | One channel overused | Add SMS and QR code options to diversify touchpoints |
| Customer burnout | Loyal customers feel over-asked | Segment VIPs for personalized, lower-frequency campaigns |
Before-and-after results from documented cases: a restaurant rotating email, SMS, and QR requests went from 2 reviews per week to 7 in two weeks. A retail store that A/B tested shorter, benefit-focused messages improved response rate from 10% to 28%. A service business using gamification increased staff review requests from 5 per week to 25, doubling total reviews.
90-Day Review Growth Projection
GMB experts use a simple compound model to project review growth after a plateau fix:
- Week 1 baseline: Record current weekly review rate (for example, 3 per week)
- Apply one fix: Expect a 2x to 3x boost within 14 days (projected range: 6 to 9 per week)
- Weeks 3 to 12: Compound at 20% weekly growth to project forward
- 90-day total: Multiply average weekly rate by 12 for quarterly volume estimate
A business starting at 3 reviews per week that applies one fix and sustains 20% weekly compounding reaches 25 or more reviews per week by day 90. Restaurants need higher volumes to move the needle in competitive local markets. Service businesses with lower average customer counts can achieve significant gains in the map pack with fewer absolute customers.
Track actual results against projections weekly using GBP Insights or BrightLocal dashboards, and adjust the fix applied if growth stalls before the two-week mark.

Amelia
Amelia is a skilled writer specializing in AI, creating engaging content that informs and inspires. She stays ahead of the latest trends to help businesses connect with their audience in a rapidly evolving digital world.
View all postsComments 0
No comments yet. Start the conversation!